Unfortunately, natural disasters are nothing new to the modern world. They occur every year in different parts of the world. So far, humanity was able to predict and manage them for the most part, but what about the future? The consequences of climate change are becoming more and more significant equating to natural disasters becoming almost uncontrollable due to their bigger scale and severity each year. An obvious solution would be a more effective mechanism of disasters monitoring, management, and even prediction. And none of that is possible without geospatial data analysis, which enables collection, visualization and analytics of different types of information for changes detection, events monitoring, prediction, and more.
So, what is geospatial data analysis? Basically, it’s a field of geographically-linked data analysis for different businesses and spheres, including environmental monitoring. One of the most major shares in this analysis is played by satellites and data they can collect. With the development of space technology, satellites are becoming more advanced, equipped with a variety of sensors to pick up different parameters of ground objects and events for further analysis. Due to this, many companies that operate within the domain of environment monitoring also use the power of satellite imagery analytics. You can visit this page eos.com to see an example of a company that offers different software for geospatial data analysis in agriculture and other industries.
How Satellite Data Enhances Disasters Monitoring
Depending on technical characteristics like temporal resolution and the amount of bands in which they collect data, modern satellites can “pick up” various information on what happens on the ground. More so, satellite pictures are available for years, which means historical images can be accessed to detect changes through a particular time period in a particular area. Overall, satellite imagery has proved maximum effectiveness in the following natural disasters monitoring:
- Wildfires. Satellite imagery layered with the data on temperature anomalies enables detection of dry therefore fire hazardous zones. On top of that, different satellite data-based software also provides data on vegetation type and wind in the area, which is helpful too for the estimation of fire spreading speed and its mitigation planning, including evacuation if necessary.
- Floods. Satellite imagery allows for water stress monitoring in the area to track any waterlogging or flood threats. Besides, remote sensing is essential in monitoring water bodies (rivers, lakes, etc), enabling prevention of related hazards.
- Earthquakes. Satellite pictures analysis can be utilized for studying ground and surface waters, which is critical when engineering for the construction in areas that are known for seismic activity.
Examples of Satellites “Catching” Natural Disasters
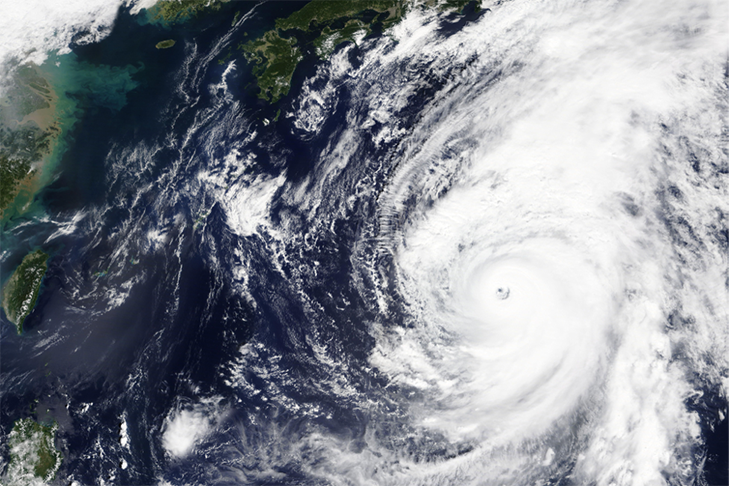
Through 2021-2022, the main cause of natural disasters is climate change followed by weather anomalies across the globe. Most of them are caught by satellite and visualized in the form of time-lapse via different geospatial data analytics software.
For example, wildfires in Turkey that occurred in July of 2021 had devastating effects on the local environment and infrastructure. Satellite imagery has allowed for monitoring the direction of fire and for planning effective evacuation from the area under threat since the disaster destroyed people’s houses, forests, arable lands, and groves.
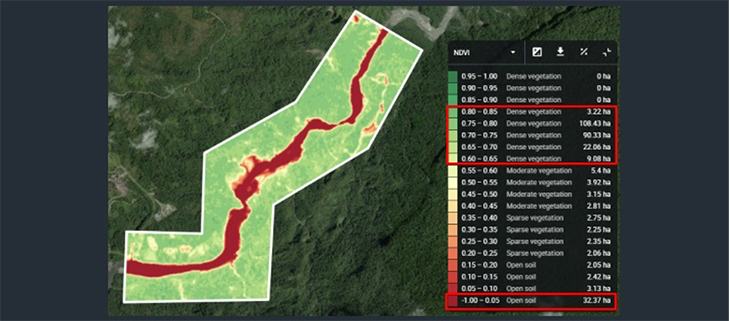
Another example of natural disaster monitoring from space can be the Amazon region notoriously famous for oil spills constantly occurring there. For instance, natural soil erosion has caused oil pipeline collapse severely affecting the surrounding flora of the Coca river. High-resolution satellite imagery of the area helped visualize the impact of oil contamination on the local vegetation. This is usually done with the help of vegetation indices like NDVI, which represents vegetation health state in the form of numeric measurements across the area. This way, the analyzed image showcases where exactly the vegetation was affected.